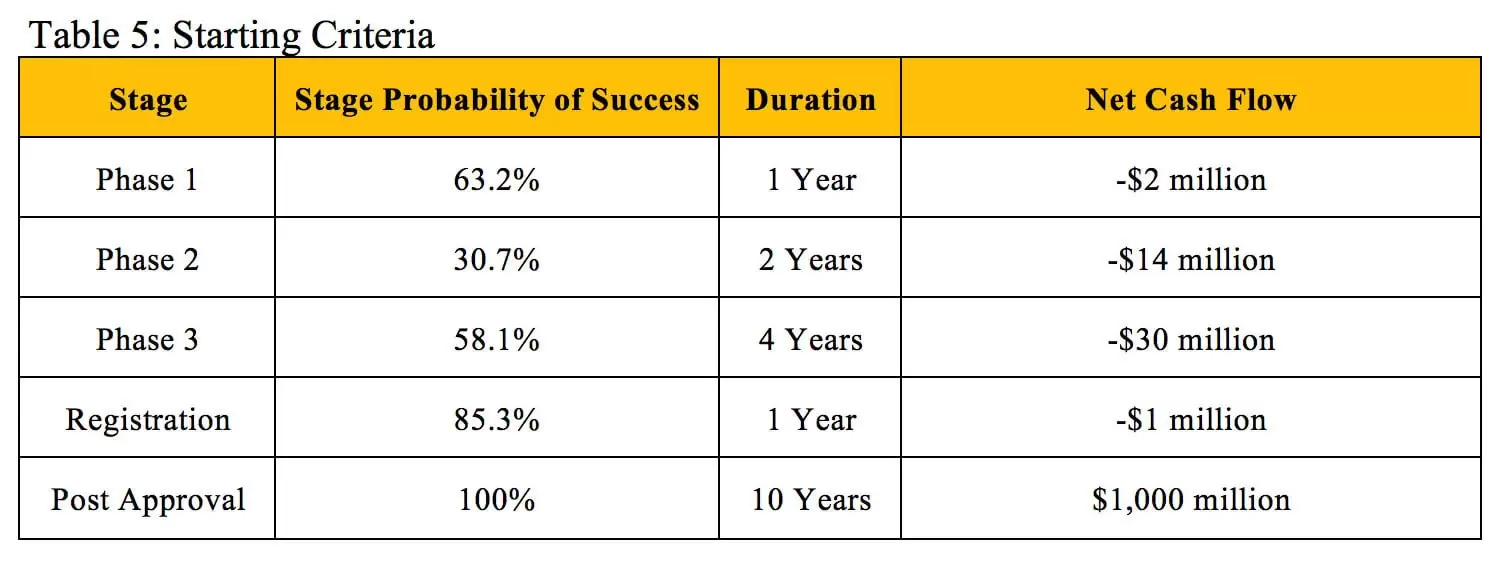
Theoretical Example
To illustrate how NPV and rNPV calculations can result in similar valuations, we will use a hypothetical investigational new drug with the criteria outlined in Table 5 that is about to enter Phase 1 clinical trials. The cost, duration and probability of success of each stage fall within the average ranges experienced across therapeutic areas (12). The drug is estimated to generate a flat $100 million in profit during each of the 10 years it remains on the market before its patent expires.
The valuations in Table 6 result from performing rNPV calculations at each stage based on the established criteria using an 11% discount rate.
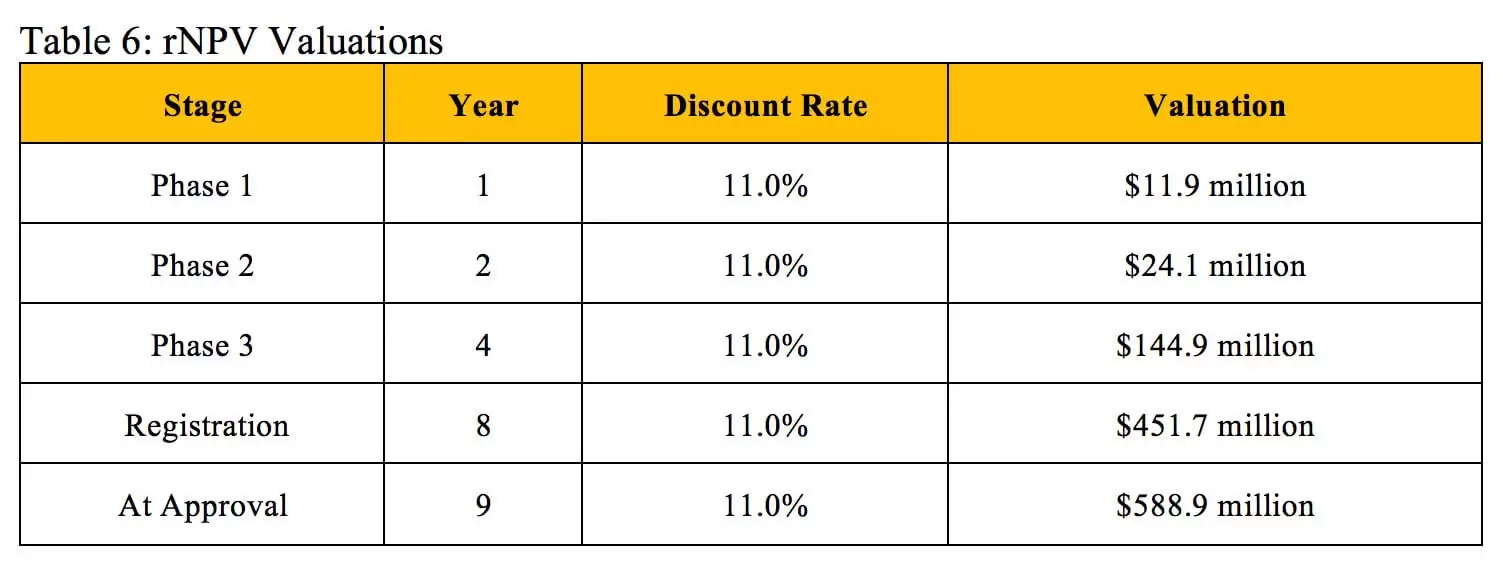
Table 7 displays valuations found through the NPV method and derives corresponding discount rates that align with the identical valuations at the same stages of development found using the rNPV method.
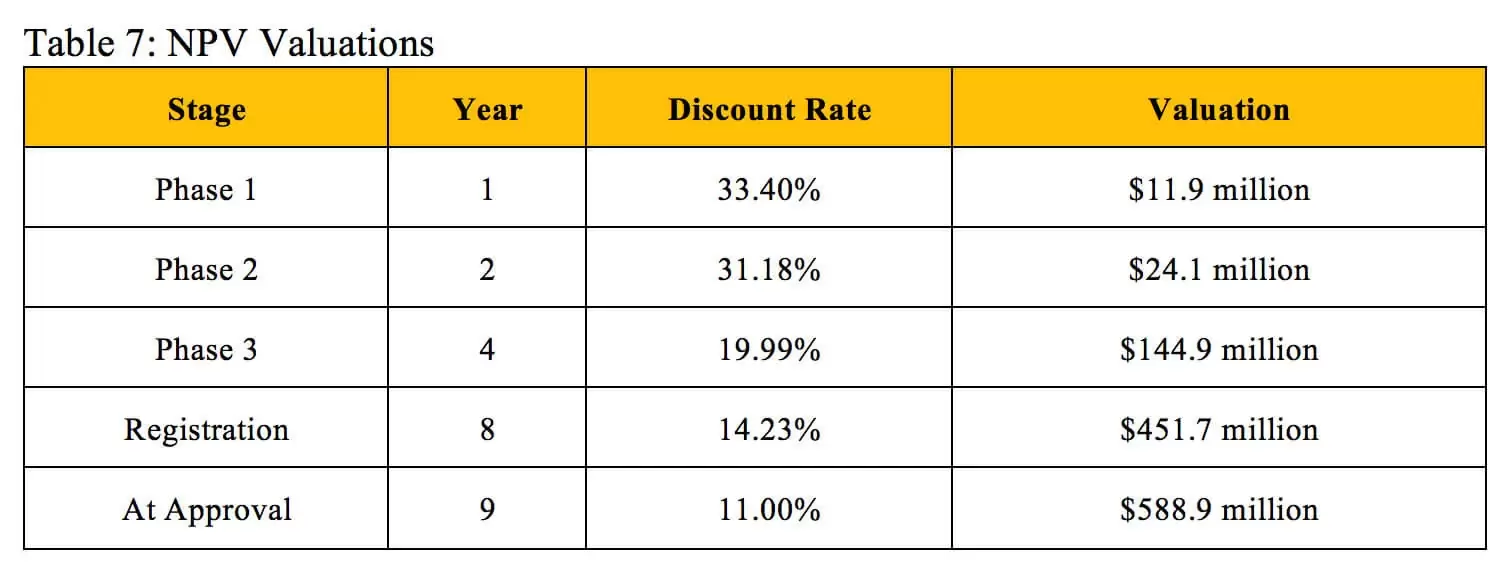
Our derived NPV discount rates generally match the industry benchmarks listed in Table 2. Biotech professionals use an average discount rate of 40.1% to calculate the NPV of early-stage projects, which also include pre-clinical assets, so this rate should slightly exceed our derived Phase 1 discount rate. The industry benchmark of 26.7% for mid-stage projects falls extremely close to the average of our derived Phase 1 discount rate and Phase 2 discount rate. The 19.5% benchmark for late-stage projects falls between our derived Phase 3 discount rate and Registration discount rate. While the industry standards for NPV discount rates do not perfectly reflect the overall probability of technical and regulatory success used in the rNPV calculation, they can provide a similar and reasonably accurate valuation at an individual stage of development.
NPV vs rNPV
If both the NPV and rNPV approaches can yield similar valuations, then why would a stakeholder choose to use rNPV when it requires supplemental information and more complicated math? Although the two methods can yield the same valuation at a given point in time, rNPV calculations better reflect changes in the investigational new drug’s present value over time while it advances through clinical trials. This cannot be accomplished using the NPV method because the calculation does not have a mechanism other than the discount rate to account for research and development risk. Figure 1 uses the same assumptions outlined in Table 6 and illustrates four different valuations at each year before the patent expires. These values were generated using an rNPV calculation with an 11% discount rate, an NPV calculation with a 33.4% discount rate, an NPV calculation with a 19.99% discount rate and an NPV calculation with an 11% discount rate.
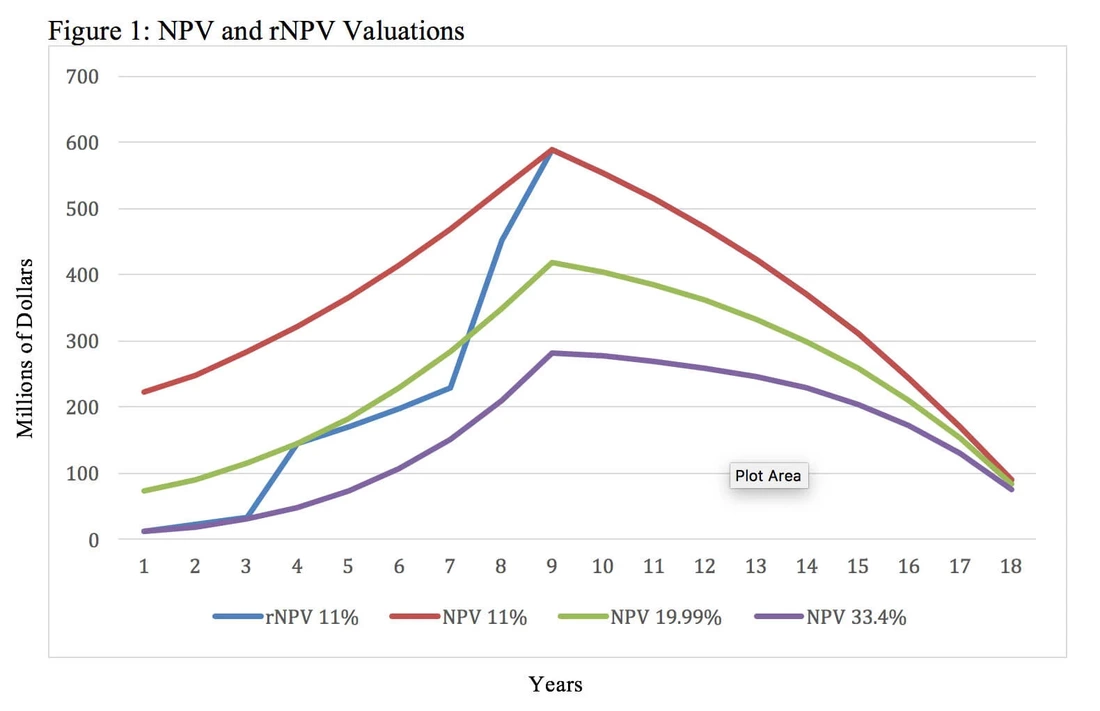
Figure 1 illustrates that while both methods can result in the same valuation at a particular point in time, the rNPV approach provides insights about the investigational new drug’s value at multiple points in time. The NPV approach requires the use of different discount rates in an attempt to approximate the evolving probability of technical and regulatory success. Each new NPV calculation and discount rate can only provide insight about the net present value and risk at a single point in time. For example, the NPV calculation with a 33.4% discount rate yields the same valuation as the rNPV method during year one, but an NPV calculation with a discount rate that high overestimates the risk during the later phases of development and post approval. This results in greatly undervaluing the asset through most of its lifecycle. Similarly, the NPV calculation with an 11% discount rate yields the same valuation as the rNPV calculation after launch, but it underestimates the risk during the earlier phases of development. This contrasts with rNPV derived valuations that increase over time as the product advances through clinical trials with the corresponding value inflection points after successful completion of Phase 1, Phase 2 and Phase 3 clinical trials.
The rNPV method allows for analyzing an in-process research and development asset’s (potential) value throughout all stages of development. This becomes particularly useful when one needs to evaluate key strategic decisions like when to raise capital and when to out-license or partner an asset. Additionally, this proves helpful when negotiating in or out licensing of an asset and quantifying the appropriate value of developmental milestone payments becomes necessary.
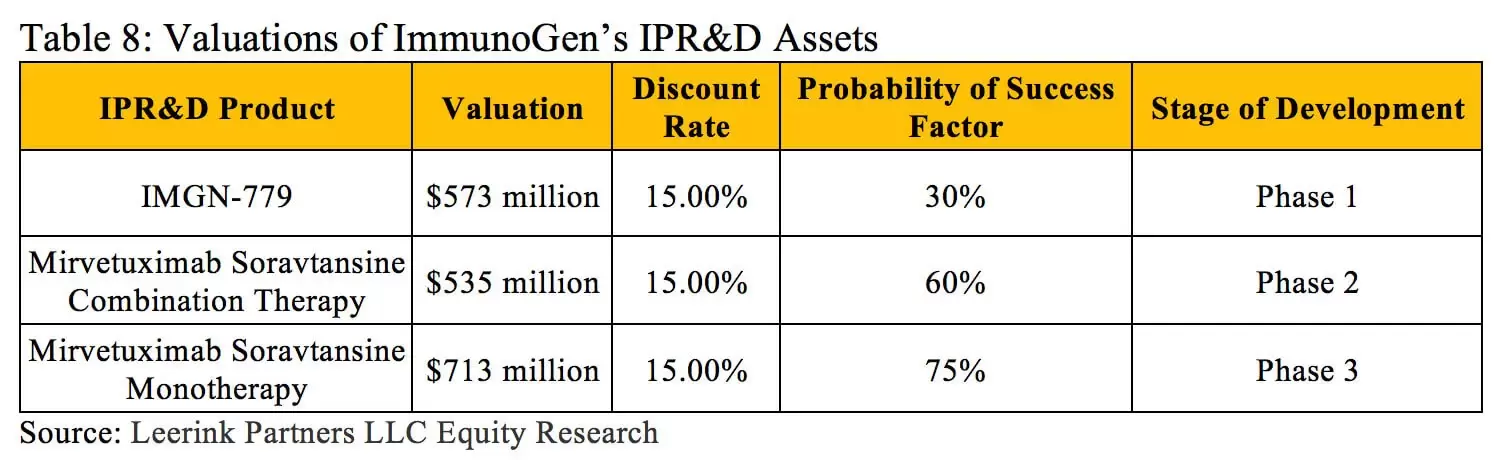
The rNPV approach also provides advantages when a company has multiple drugs in development within different therapeutic areas. Each new drug may have its own probability of success at each stage of development depending on its therapeutic class, mechanism of action, molecular size, etc. These specific factors can all be analyzed and accounted for using historical success rate data when determining the value of each asset with an rNPV calculation. For instance, ImmunoGen Inc. currently has three in-process research and development assets, and each has its own characteristics and risk profile (outlined in Table 8) (13).
The rNPV method allows for analyzing an in-process research and development asset’s (potential) value throughout all stages of development. This becomes particularly useful when one needs to evaluate key strategic decisions like when to raise capital and when to out-license or partner an asset. Additionally, this proves helpful when negotiating in or out licensing of an asset and quantifying the appropriate value of developmental milestone payments becomes necessary.
The rNPV approach also provides advantages when a company has multiple drugs in development within different therapeutic areas. Each new drug may have its own probability of success at each stage of development depending on its therapeutic class, mechanism of action, molecular size, etc. These specific factors can all be analyzed and accounted for using historical success rate data when determining the value of each asset with an rNPV calculation. For instance, ImmunoGen Inc. currently has three in-process research and development assets, and each has its own characteristics and risk profile (outlined in Table 8) (13).
ImmunoGen’s weighted average cost of capital provides an accurate discount rate for determining the NPV of the entire firm, but using this discount rate to assess the value of each asset would result in widely inaccurate valuations. The rNPV method can further support the portfolio planning process when companies attempt to prioritize multiple R&D projects under consideration.
In summary, the NPV method simply and easily determines the current value of an in-process research and development asset based on its expected revenues/costs and the overall risk of it failing to reach the market. When investors want to determine the value of a drug development company or the collective value of all its assets, the company’s weighted average cost of capital provides a reasonable discount rate for calculating NPV. The NPV approach can provide enough information to adequately inform purchase/investment decisions that primarily rely on the current value of the asset. The rNPV method constitutes a more involved and complicated approach, but relying on clinical trial success rate data to incorporate risk into the calculation often results in a more accurate valuation. It also can reflect the decreasing risk of an asset at multiple stages of development without having to perform new calculations with different discount rates. This approach allows stakeholders to make decisions that capture future value as it is created while reflecting the nuances around the variance of probability at each individual stage of development. These characteristics make the rNPV method an extremely useful and dynamic tool. A wide range of stakeholders employ both methods, so understanding the underlying calculations, their differences and the factors that play the largest role in determining the resulting valuations remains important.
In summary, the NPV method simply and easily determines the current value of an in-process research and development asset based on its expected revenues/costs and the overall risk of it failing to reach the market. When investors want to determine the value of a drug development company or the collective value of all its assets, the company’s weighted average cost of capital provides a reasonable discount rate for calculating NPV. The NPV approach can provide enough information to adequately inform purchase/investment decisions that primarily rely on the current value of the asset. The rNPV method constitutes a more involved and complicated approach, but relying on clinical trial success rate data to incorporate risk into the calculation often results in a more accurate valuation. It also can reflect the decreasing risk of an asset at multiple stages of development without having to perform new calculations with different discount rates. This approach allows stakeholders to make decisions that capture future value as it is created while reflecting the nuances around the variance of probability at each individual stage of development. These characteristics make the rNPV method an extremely useful and dynamic tool. A wide range of stakeholders employ both methods, so understanding the underlying calculations, their differences and the factors that play the largest role in determining the resulting valuations remains important.
